jQuery Datatable with amChart
Download this Project @ GitHub
Posted on August 9, 2020

The jQuery Datatables plugin library unlocks high levels of accessibility for data in simple HTML tables. It is able to give instant filtering, searching, ordering, and paging. It is free to use and can be forked from GitHub. Their documentation has examples for loading data with API or other plug-in interfaces. The library can be brought in with three lines and then setup is complete:
<script type="text/javascript" src="https://code.jquery.com/jquery-3.5.1.js"></script>
<script type="text/javascript" src="https://cdn.datatables.net/1.10.21/js/jquery.dataTables.min.js"></script>
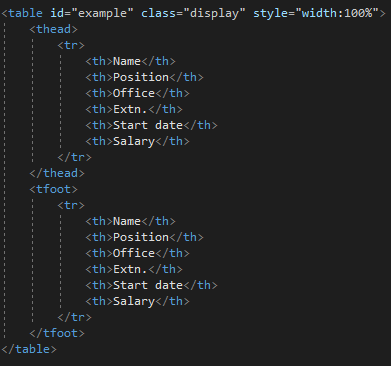
<link rel="stylesheet" href="https://cdn.datatables.net/1.10.21/css/jquery.dataTables.min.css" />Define how the table will be structured on the page:
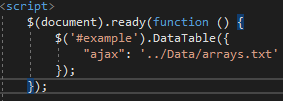
Initialize the table:
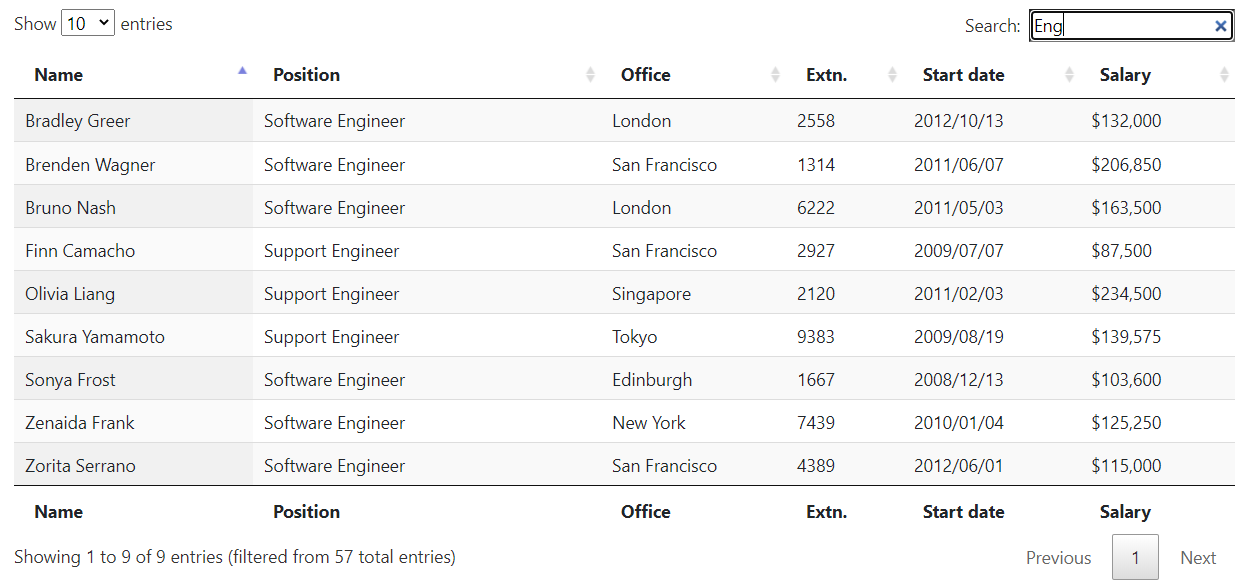
Then the table will be ready for the end user:
amCharts
amCharts is a free robust Javascript library that creates flexible charts and graphs. They offer a wide variety of user functions including scolling, hovering, dragging, and selecting. amCharts integrates with TypeScript, Angular, React, Vue, and plain JavaScript applications. The source code is hosted on GitHub. They offer extensive documentation and plenty of examples to copy from. The initialization will only need three additional lines because jQuery is already included:
<script type="text/javascript" src="https://cdn.amcharts.com/lib/4/core.js"></script>
<script type="text/javascript" src="https://cdn.amcharts.com/lib/4/charts.js"></script>
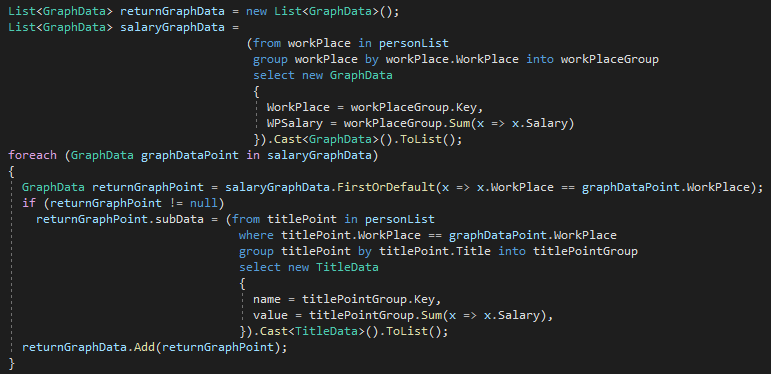
<script type="text/javascript" src="https://cdn.amcharts.com/lib/4/themes/animated.js"></script>This Pie of a Pie (exploding pie chart) example was used as the basis for the chart used in the final code. A couple changes were made for the values to fit the datasource for this dashboard. On the backend, the data text file was converted to build the arrays for the datasource. These values were passed from the model to the view using C# as the code behind. The model had a custom function that formatted and returned the data for the chart.
Here is our finished product:
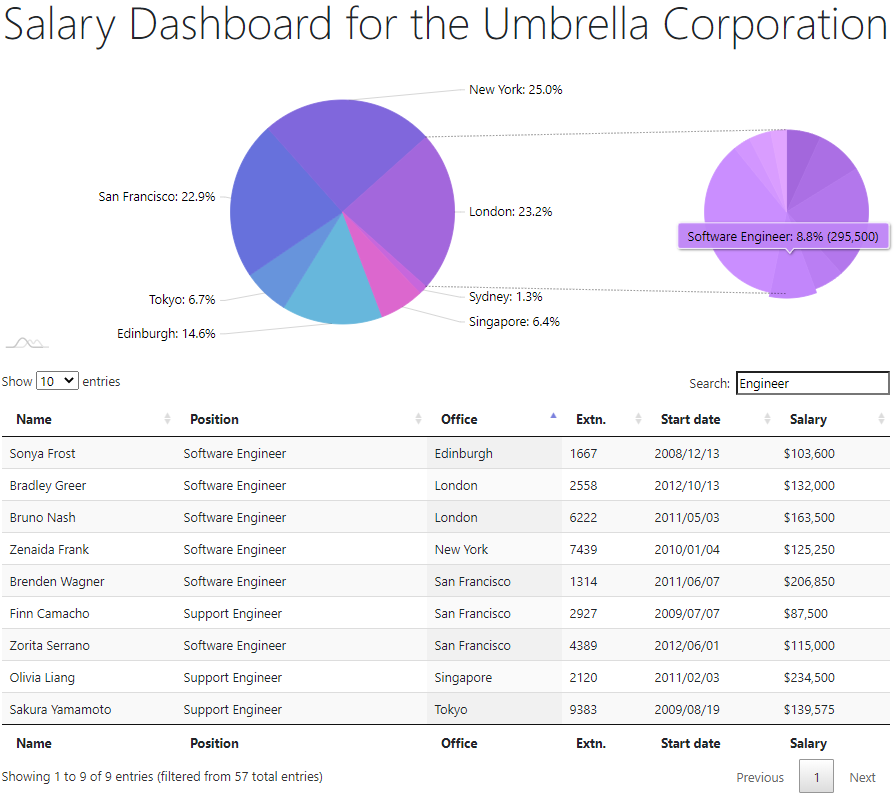
Combining two free open source jQuery libraries created a very simple end-user friendly dashboard to deliver the data needed to make decisions for the business.